Cloud Computing Projekt
Raspberry Pi Cluster mit KI-basierter Objekterkennung, MPI und Monitoring
Prometheus & Grafana Monitoring Setup
This manual provides a guide for setting up:
- Prometheus
- Grafana
- Prometheus Node Exporter
- cAdvisor
- Alertmanager
The Master Node runs Prometheus, Grafana, Alertmanager, and cAdvisor, whereas the Worker Nodes run the Prometheus Node Exporter.
The components and their purposes are displayed below:
| Component | Purpose |
|---|---|
| Prometheus | Collects and stores metrics |
| Grafana | Visualizes collected metrics |
| Node Exporter | Exposes hardware and OS metrics |
| cAdvisor | Exposes Docker container metrics |
| Alertmanager | Receives and routes Prometheus alerts |
Table of Contents
- Requirements
- Prometheus Installation
- Grafana Installation
- Node Exporter Installation
- cAdvisor Installation
- Blackbox Exporter Installation
- Alertmanager Configuration
- Alert Rules
- Prometheus Configuration
- Dashboard Configuration
- Grafana Setup
- Verification
- References
Requirements
The following requirements need to be met on the Master node and on the worker nodes to set up everything:
- Master Node
- Raspberry Pi OS
- Internet connection
- SSH access to remote nodes
- Raspberry Pi Worker Nodes
- Raspberry Pi OS
- SSH enabled
- User
usernameconfigured
- A Telegram bot
Prometheus Installation
- Update the system packages:
sudo apt update && sudo apt upgrade -y
- Install Prometheus:
sudo apt install prometheus
Check the Prometheus service status:
systemctl status prometheus
Allow Prometheus through the firewall:
sudo ufw allow 9090
The Prometheus Web Interface can be accessed at:
http://<master-ip>:9090
Grafana Installation
- Create the keyring directory:
sudo mkdir -p /etc/apt/keyrings/
- Import the Grafana GPG key:
sudo wget -q -O - https://apt.grafana.com/gpg.key | gpg --dearmor | sudo tee /etc/apt/keyrings/grafana.gpg > /dev/null
- Add the Grafana repository:
echo "deb [signed-by=/etc/apt/keyrings/grafana.gpg] https://apt.grafana.com stable main" | sudo tee -a /etc/apt/sources.list.d/grafana.list
- Update the package index:
sudo apt update
- Install Grafana:
sudo apt install grafana
- Enable and start the Grafana service:
sudo systemctl daemon-reload
sudo systemctl enable grafana-server
sudo systemctl start grafana-server
- Check the Grafana service status:
sudo systemctl status grafana-server
The Grafana Web Interface can be accessed at:
http://<master-ip>:3000
Default login credentials:
| Username | Password |
|---|---|
| admin | admin |
Note: A prompt will appear on the first login, which asks to change the default password.
Node Exporter Installation
To monitor remote systems, the Prometheus Node Exporter must be installed on every worker node. Therefore, the package is downloaded on the Master Node and then provisioned to the Worker Nodes.
apt download prometheus-node-exporter
- Copy the downloaded package to each Worker Node.
scp prometheus-node-exporter_1.9.0-1+b4_arm64.deb pi@rpi1:/tmp/
scp prometheus-node-exporter_1.9.0-1+b4_arm64.deb pi@rpi2:/tmp/
scp prometheus-node-exporter_1.9.0-1+b4_arm64.deb pi@rpi3:/tmp/
scp prometheus-node-exporter_1.9.0-1+b4_arm64.deb pi@rpi4:/tmp/
scp prometheus-node-exporter_1.9.0-1+b4_arm64.deb pi@rpi5:/tmp/
scp prometheus-node-exporter_1.9.0-1+b4_arm64.deb pi@rpi6:/tmp/
scp prometheus-node-exporter_1.9.0-1+b4_arm64.deb pi@rpi7:/tmp/
scp prometheus-node-exporter_1.9.0-1+b4_arm64.deb pi@rpi8:/tmp/

# For the camera node:
scp prometheus-node-exporter_1.9.0-1+b4_arm64.deb user@192.168.50.20:/tmp/
- Install and start the service on each Worker Node:
sudo dpkg -i /tmp/prometheus-node-exporter_1.9.0-1+b4_arm64.deb || sudo apt -f install -y
sudo systemctl enable --now prometheus-node-exporter
- Verify the service:
sudo systemctl status prometheus-node-exporter
The Metrics endpoint can be accessed at:
http://192.168.50.11:9100/metrics
cAdvisor Installation
To monitor Docker containers, cAdvisor must be deployed.
- Start the cAdvisor container:
docker run -d \
  --name=cadvisor \
  --restart=unless-stopped \
  -p 8080:8080 \
  -v /:/rootfs:ro \
  -v /var/run:/var/run:ro \
  -v /sys:/sys:ro \
  -v /var/lib/docker:/var/lib/docker:ro \
  -v /dev/disk:/dev/disk:ro \
  gcr.io/cadvisor/cadvisor:latest
- Verify that the container is running:
docker ps
- Verify that the metrics endpoint is accessible:
http://192.168.50.1:8080/metrics
Blackbox Exporter Installation
The Blackbox Exporter checks services and network endpoints externally for reachability and correct responses.
- Create the configuration file on the Master Node:
sudo nano blackbox.yml
with the following content:
modules:
  http_2xx:
    prober: http
    timeout: 5s
    http:
      preferred_ip_protocol: ip4
      follow_redirects: true

  tcp_connect:
    prober: tcp
    timeout: 5s

  icmp:
    prober: icmp
    timeout: 5s
- Start the container:
docker run -d \
  --name blackbox_exporter \
  --restart unless-stopped \
  -p 9115:9115 \
  -v "$(pwd)/blackbox.yml:/config/blackbox.yml:ro" \
  quay.io/prometheus/blackbox-exporter:latest \
  --config.file=/config/blackbox.yml
- Verify that the health endpoint is accessible:
docker ps
curl http://localhost:9115/-/healthy
Alertmanager Configuration
Install and configure Alertmanager on the Master Node.
sudo apt install -y prometheus-alertmanager
sudo systemctl enable --now prometheus-alertmanager
systemctl status prometheus-alertmanager
Alertmanager can be opened at http://192.168.50.1:9093.
In this setup, Telegram is used as the notification channel.
sudo nano /etc/prometheus/alertmanager.yml
with the following content:
global:
  resolve_timeout: 5m

route:
  group_by: ['alertname']
  group_wait: 30s
  group_interval: 5m
  repeat_interval: 3h
  receiver: telegram

receivers:
  - name: telegram
    telegram_configs:
      - bot_token: '<TELEGRAM_BOT_TOKEN>'
        chat_id: 123456789
        send_resolved: true
Validate and restart Alertmanager:
sudo amtool check-config /etc/prometheus/alertmanager.yml
sudo systemctl restart prometheus-alertmanager
systemctl status prometheus-alertmanager
Prometheus Configuration
To monitor the exporters and cAdvisor, the Prometheus configuration file on the Master Node needs to be updated.
- Open the configuration file:
sudo nano /etc/prometheus/prometheus.yml
Example configuration:
global:
  scrape_interval: 15s
  evaluation_interval: 15s
  external_labels:
    monitor: 'example'

alerting:
  alertmanagers:
    - static_configs:
        - targets: ['localhost:9093']

rule_files:
  - "/etc/prometheus/rules/alerts.yml"

scrape_configs:
  - job_name: 'prometheus'
    scrape_interval: 5s
    scrape_timeout: 5s
    static_configs:
      - targets: ['localhost:9090']

  - job_name: node
    static_configs:
      - targets: ['localhost:9100']

  - job_name: 'pi-1'
    static_configs:
      - targets: ['192.168.50.11:9100']
  - job_name: 'pi-2'
    static_configs:
      - targets: ['192.168.50.12:9100']
  - job_name: 'pi-3'
    static_configs:
      - targets: ['192.168.50.13:9100']
  - job_name: 'pi-4'
    static_configs:
      - targets: ['192.168.50.14:9100']
  - job_name: 'pi-5'
    static_configs:
      - targets: ['192.168.50.15:9100']
  - job_name: 'pi-6'
    static_configs:
      - targets: ['192.168.50.16:9100']
  - job_name: 'pi-7'
    static_configs:
      - targets: ['192.168.50.17:9100']
  - job_name: 'pi-8'
    static_configs:
      - targets: ['192.168.50.18:9100']

  - job_name: 'pi-camera'
    static_configs:
      - targets: ['192.168.50.20:9100']

  - job_name: 'cadvisor'
    static_configs:
      - targets: ['192.168.50.1:8080']

  - job_name: 'blackbox-exporter'
    static_configs:
      - targets: ['192.168.50.1:9115']

  - job_name: 'blackbox-backend'
    metrics_path: /probe
    params:
      module: [http_2xx]
    static_configs:
      - targets:
          - http://192.168.50.1:8000/health
          - http://192.168.50.1:8888
    relabel_configs:
      - source_labels: [__address__]
        target_label: __param_target
      - source_labels: [__param_target]
        target_label: instance
      - target_label: __address__
        replacement: 192.168.50.1:9115
Restart Prometheus after editing:
sudo systemctl restart prometheus
Alert Rules
The rules are stored on the Master Node by using these commands:
sudo mkdir -p /etc/prometheus/rules
sudo nano /etc/prometheus/rules/alerts.yml
Example configuration:
groups:
  - name: infrastructure
    rules:
      - alert: NodeDown
        expr: up{job=~"node|pi-.*"} == 0
        for: 2m
        labels:
          severity: critical
        annotations:
          summary: "Node is down"
          description: " has been unreachable for more than 2 minutes."

      - alert: RootFilesystemUsageHigh
        expr: |
          (1 - (node_filesystem_avail_bytes{mountpoint="/",fstype!~"tmpfs|overlay|squashfs"} / node_filesystem_size_bytes{mountpoint="/",fstype!~"tmpfs|overlay|squashfs"})) * 100 >= 80
          and
          (1 - (node_filesystem_avail_bytes{mountpoint="/",fstype!~"tmpfs|overlay|squashfs"} / node_filesystem_size_bytes{mountpoint="/",fstype!~"tmpfs|overlay|squashfs"})) * 100 < 90
        for: 5m
        labels:
          severity: warning
        annotations:
          summary: "Root filesystem usage is high"
          description: ": Root filesystem (/) usage is %."

      - alert: RootFilesystemUsageCritical
        expr: |
          (1 - (node_filesystem_avail_bytes{mountpoint="/",fstype!~"tmpfs|overlay|squashfs"} / node_filesystem_size_bytes{mountpoint="/",fstype!~"tmpfs|overlay|squashfs"})) * 100 >= 90
          and
          (1 - (node_filesystem_avail_bytes{mountpoint="/",fstype!~"tmpfs|overlay|squashfs"} / node_filesystem_size_bytes{mountpoint="/",fstype!~"tmpfs|overlay|squashfs"})) * 100 < 95
        for: 5m
        labels:
          severity: critical
        annotations:
          summary: "Root filesystem usage is critical"
          description: ": Root filesystem (/) usage is %."

      - alert: RootFilesystemAlmostFull
        expr: |
          (1 - (node_filesystem_avail_bytes{mountpoint="/",fstype!~"tmpfs|overlay|squashfs"} / node_filesystem_size_bytes{mountpoint="/",fstype!~"tmpfs|overlay|squashfs"})) * 100 >= 95
        for: 2m
        labels:
          severity: critical
        annotations:
          summary: "Root filesystem is almost full"
          description: ": Root filesystem (/) usage is %. Less than 5% of the filesystem is available."

      - alert: RootFilesystemLowSpace
        expr: |
          node_filesystem_avail_bytes{mountpoint="/",fstype!~"tmpfs|overlay|squashfs"} < 1073741824
          and
          (node_filesystem_avail_bytes{mountpoint="/",fstype!~"tmpfs|overlay|squashfs"} / node_filesystem_size_bytes{mountpoint="/",fstype!~"tmpfs|overlay|squashfs"}) > 0.20
        for: 5m
        labels:
          severity: warning
        annotations:
          summary: "Root filesystem has little free space"
          description: ": Less than 1 GiB is available on /."

      - alert: RootFilesystemInodesLow
        expr: |
          (node_filesystem_files_free{mountpoint="/",fstype!~"tmpfs|overlay|squashfs"} / node_filesystem_files{mountpoint="/",fstype!~"tmpfs|overlay|squashfs"}) * 100 >= 5
          and
          (node_filesystem_files_free{mountpoint="/",fstype!~"tmpfs|overlay|squashfs"} / node_filesystem_files{mountpoint="/",fstype!~"tmpfs|overlay|squashfs"}) * 100 < 20
        for: 5m
        labels:
          severity: warning
        annotations:
          summary: "Root filesystem has low inode availability"
          description: ": Only % of inodes are available on /."

      - alert: RootFilesystemInodesCritical
        expr: |
          (node_filesystem_files_free{mountpoint="/",fstype!~"tmpfs|overlay|squashfs"} / node_filesystem_files{mountpoint="/",fstype!~"tmpfs|overlay|squashfs"}) * 100 < 5
        for: 2m
        labels:
          severity: critical
        annotations:
          summary: "Root filesystem is critically low on inodes"
          description: ": Only % of inodes are available on /."

      - alert: HighCPUUsage
        expr: |
          100 - (avg by(instance) (rate(node_cpu_seconds_total{mode="idle"}[5m])) * 100) >= 80
          and
          100 - (avg by(instance) (rate(node_cpu_seconds_total{mode="idle"}[5m])) * 100) < 95
        for: 5m
        labels:
          severity: warning
        annotations:
          summary: "High CPU usage"
          description: ": CPU usage has been % for more than 5 minutes."

      - alert: CriticalCPUUsage
        expr: 100 - (avg by(instance) (rate(node_cpu_seconds_total{mode="idle"}[5m])) * 100) >= 95
        for: 5m
        labels:
          severity: critical
        annotations:
          summary: "Critical CPU usage"
          description: ": CPU usage has been % for more than 5 minutes."

      - alert: HighMemoryUsage
        expr: |
          (1 - (node_memory_MemAvailable_bytes / node_memory_MemTotal_bytes)) * 100 >= 80
          and
          (1 - (node_memory_MemAvailable_bytes / node_memory_MemTotal_bytes)) * 100 < 90
        for: 5m
        labels:
          severity: warning
        annotations:
          summary: "High memory usage"
          description: ": Memory usage is %."

      - alert: CriticalMemoryUsage
        expr: (1 - (node_memory_MemAvailable_bytes / node_memory_MemTotal_bytes)) * 100 >= 90
        for: 5m
        labels:
          severity: critical
        annotations:
          summary: "Critical memory usage"
          description: ": Memory usage is %."

      - alert: HighSystemLoad
        expr: node_load5 / count by(instance) (node_cpu_seconds_total{mode="idle"}) > 1.5
        for: 10m
        labels:
          severity: warning
        annotations:
          summary: "High system load"
          description: ": 5-minute load average is  per CPU core."

      - alert: FilesystemReadOnly
        expr: node_filesystem_readonly{mountpoint="/"} == 1
        for: 2m
        labels:
          severity: critical
        annotations:
          summary: "Root filesystem is read-only"
          description: ": Root filesystem (/) is mounted as read-only."
Alerts are classified with severity: warning or severity: critical.
| Area | Alerts | Threshold / condition |
|---|---|---|
| Availability | NodeDown |
Node Exporter target down for 2 minutes |
| Root filesystem | RootFilesystemUsageHigh, RootFilesystemUsageCritical, RootFilesystemAlmostFull |
80–90 %, 90–95 %, or at least 95 % used |
| Free space | RootFilesystemLowSpace |
Less than 1 GiB available while more than 20 % remains |
| Inodes | RootFilesystemInodesLow, RootFilesystemInodesCritical |
5–20 % or less than 5 % free |
| CPU | HighCPUUsage, CriticalCPUUsage |
80–95 % or at least 95 % for 5 minutes |
| Memory | HighMemoryUsage, CriticalMemoryUsage |
80–90 % or at least 90 % used |
| System load | HighSystemLoad |
Five-minute load exceeds 1.5 per CPU core for 10 minutes |
| Filesystem state | FilesystemReadOnly |
Root filesystem is mounted read-only for 2 minutes |
Check the rule file before restarting Prometheus:
sudo promtool check rules /etc/prometheus/rules/alerts.yml
sudo systemctl restart prometheus
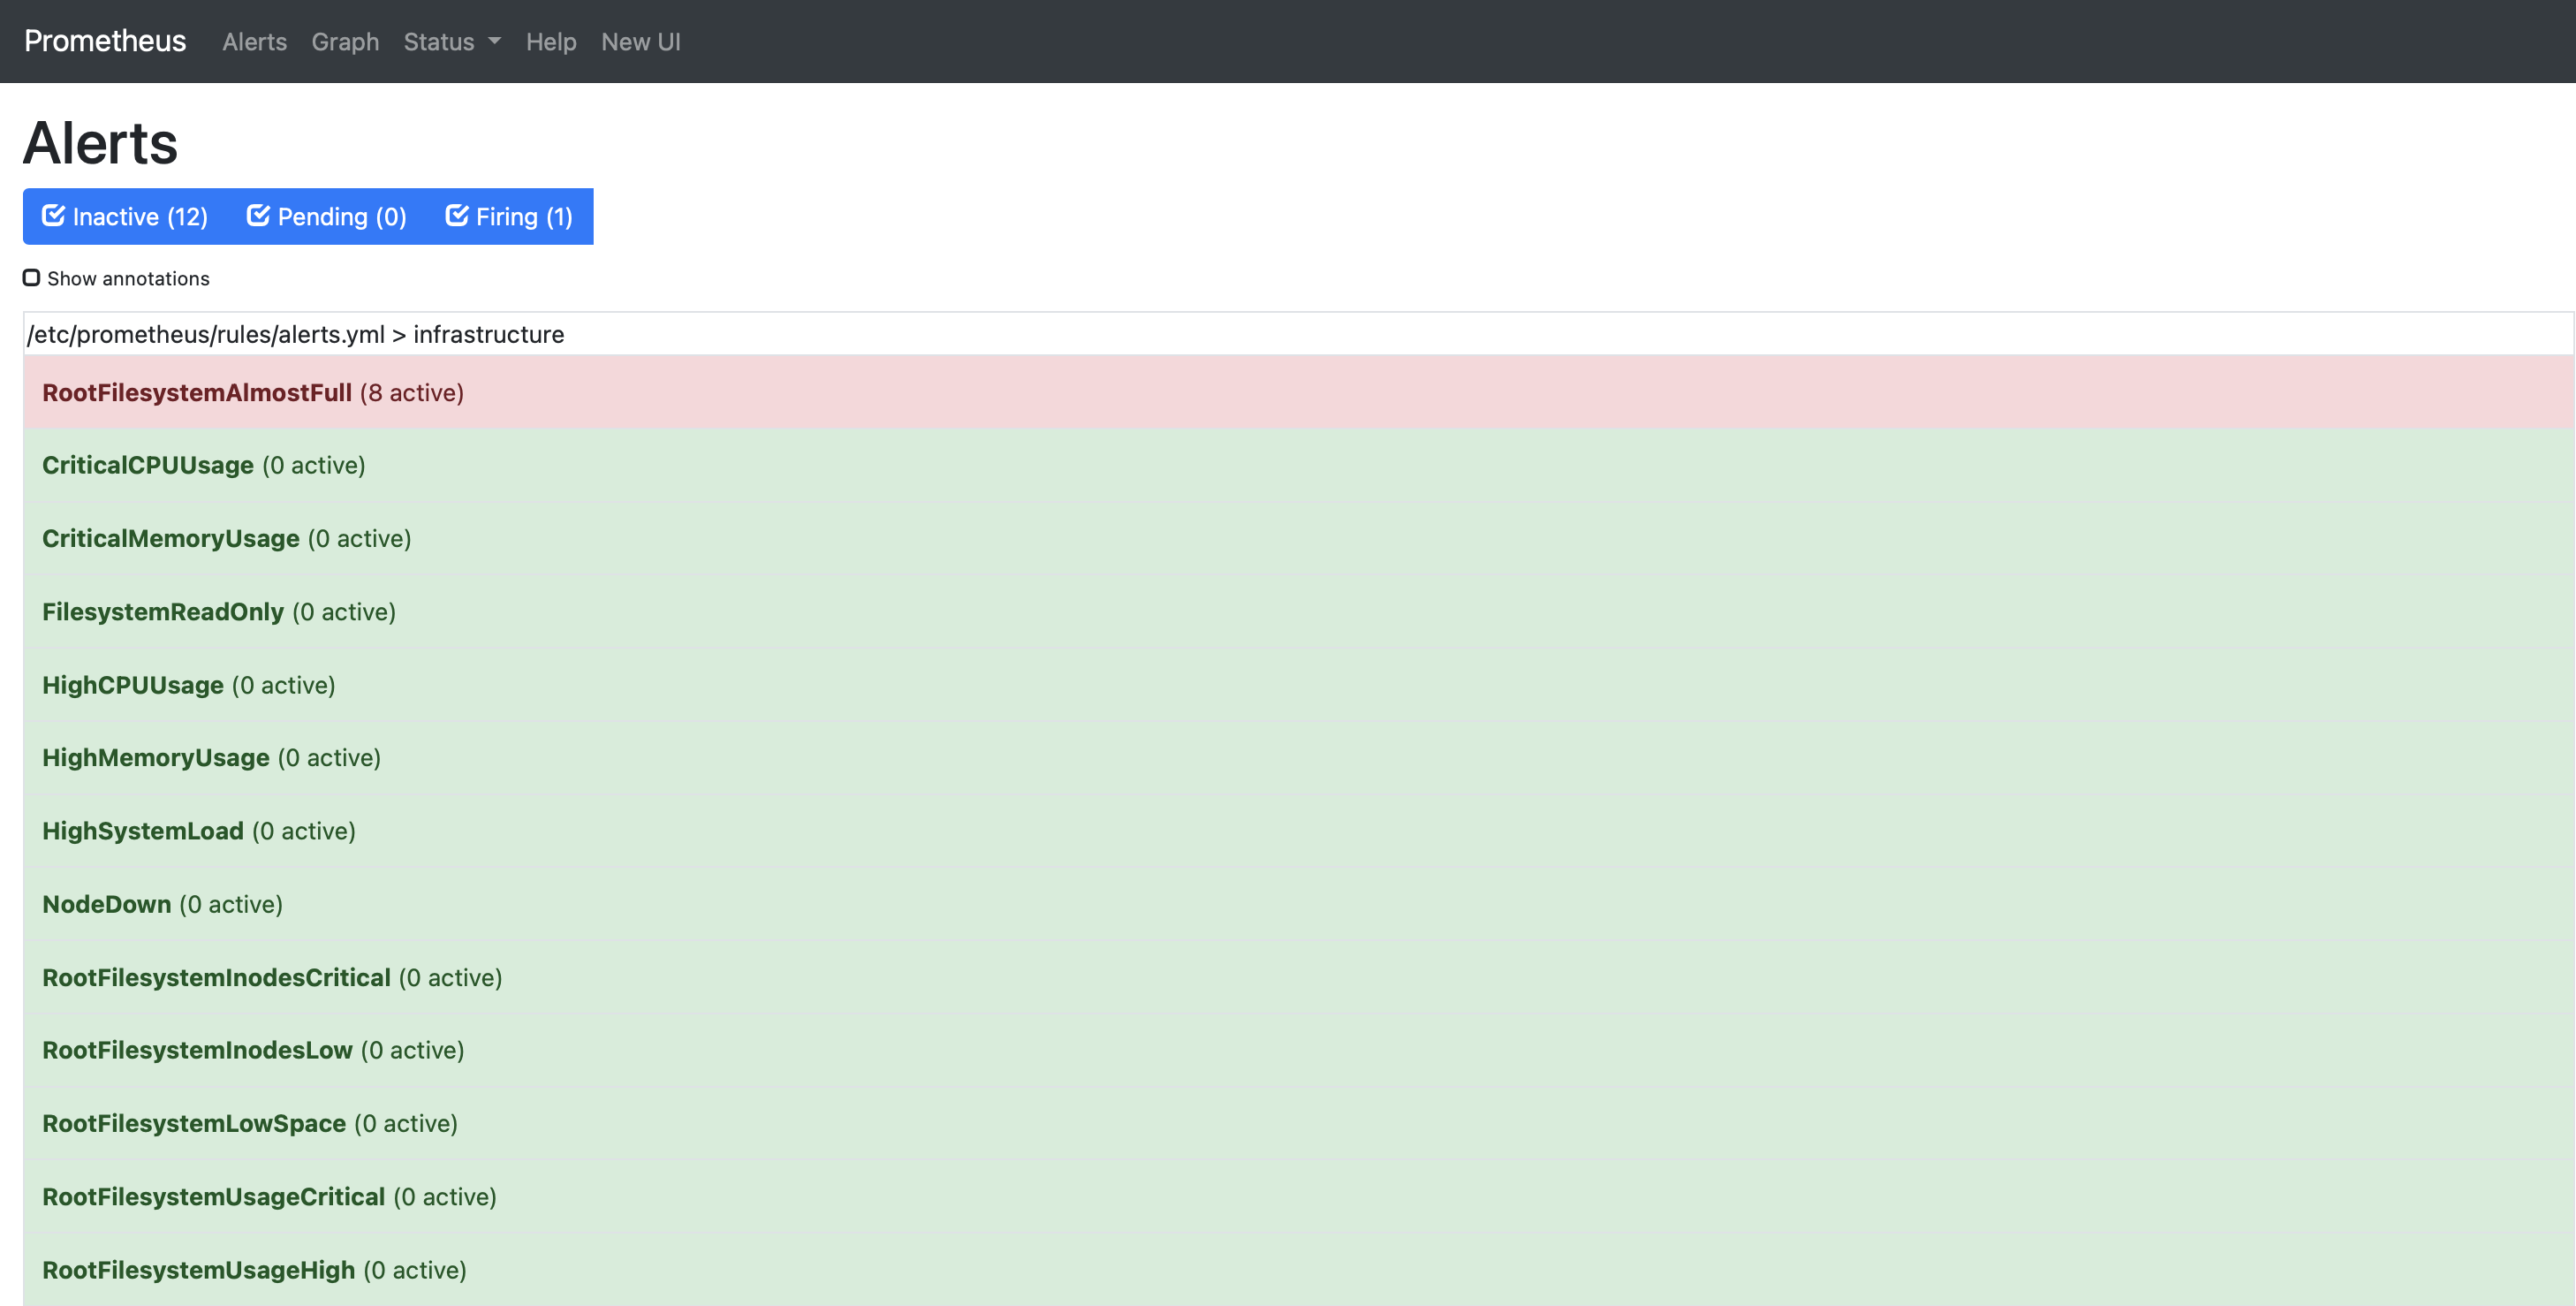
Verify the alert rules in Prometheus at http://<master-ip>:9090/alerts.
The following example shows the configured infrastructure rule group and an active alert:
Grafana Setup
- Add a Data Source:
Connections -> Data Sources -> Add new Data Source
-
Select
Prometheusas a Data Source: -
Afterward, configure the URL:
http://localhost:9090
- Save and test the connection.
Dashboard Configuration
The recommended dashboard ID is the following:
1860
To import the dashboard, the following steps need to be performed:
- Got to Dashboards
- Click on New and select Import
- Enter the Dashboard ID
- Select the Prometheus Data Source
- Import
The following screenshot shows the detailed Grafana view with CPU, memory, network, and filesystem panels used for the monitored host:
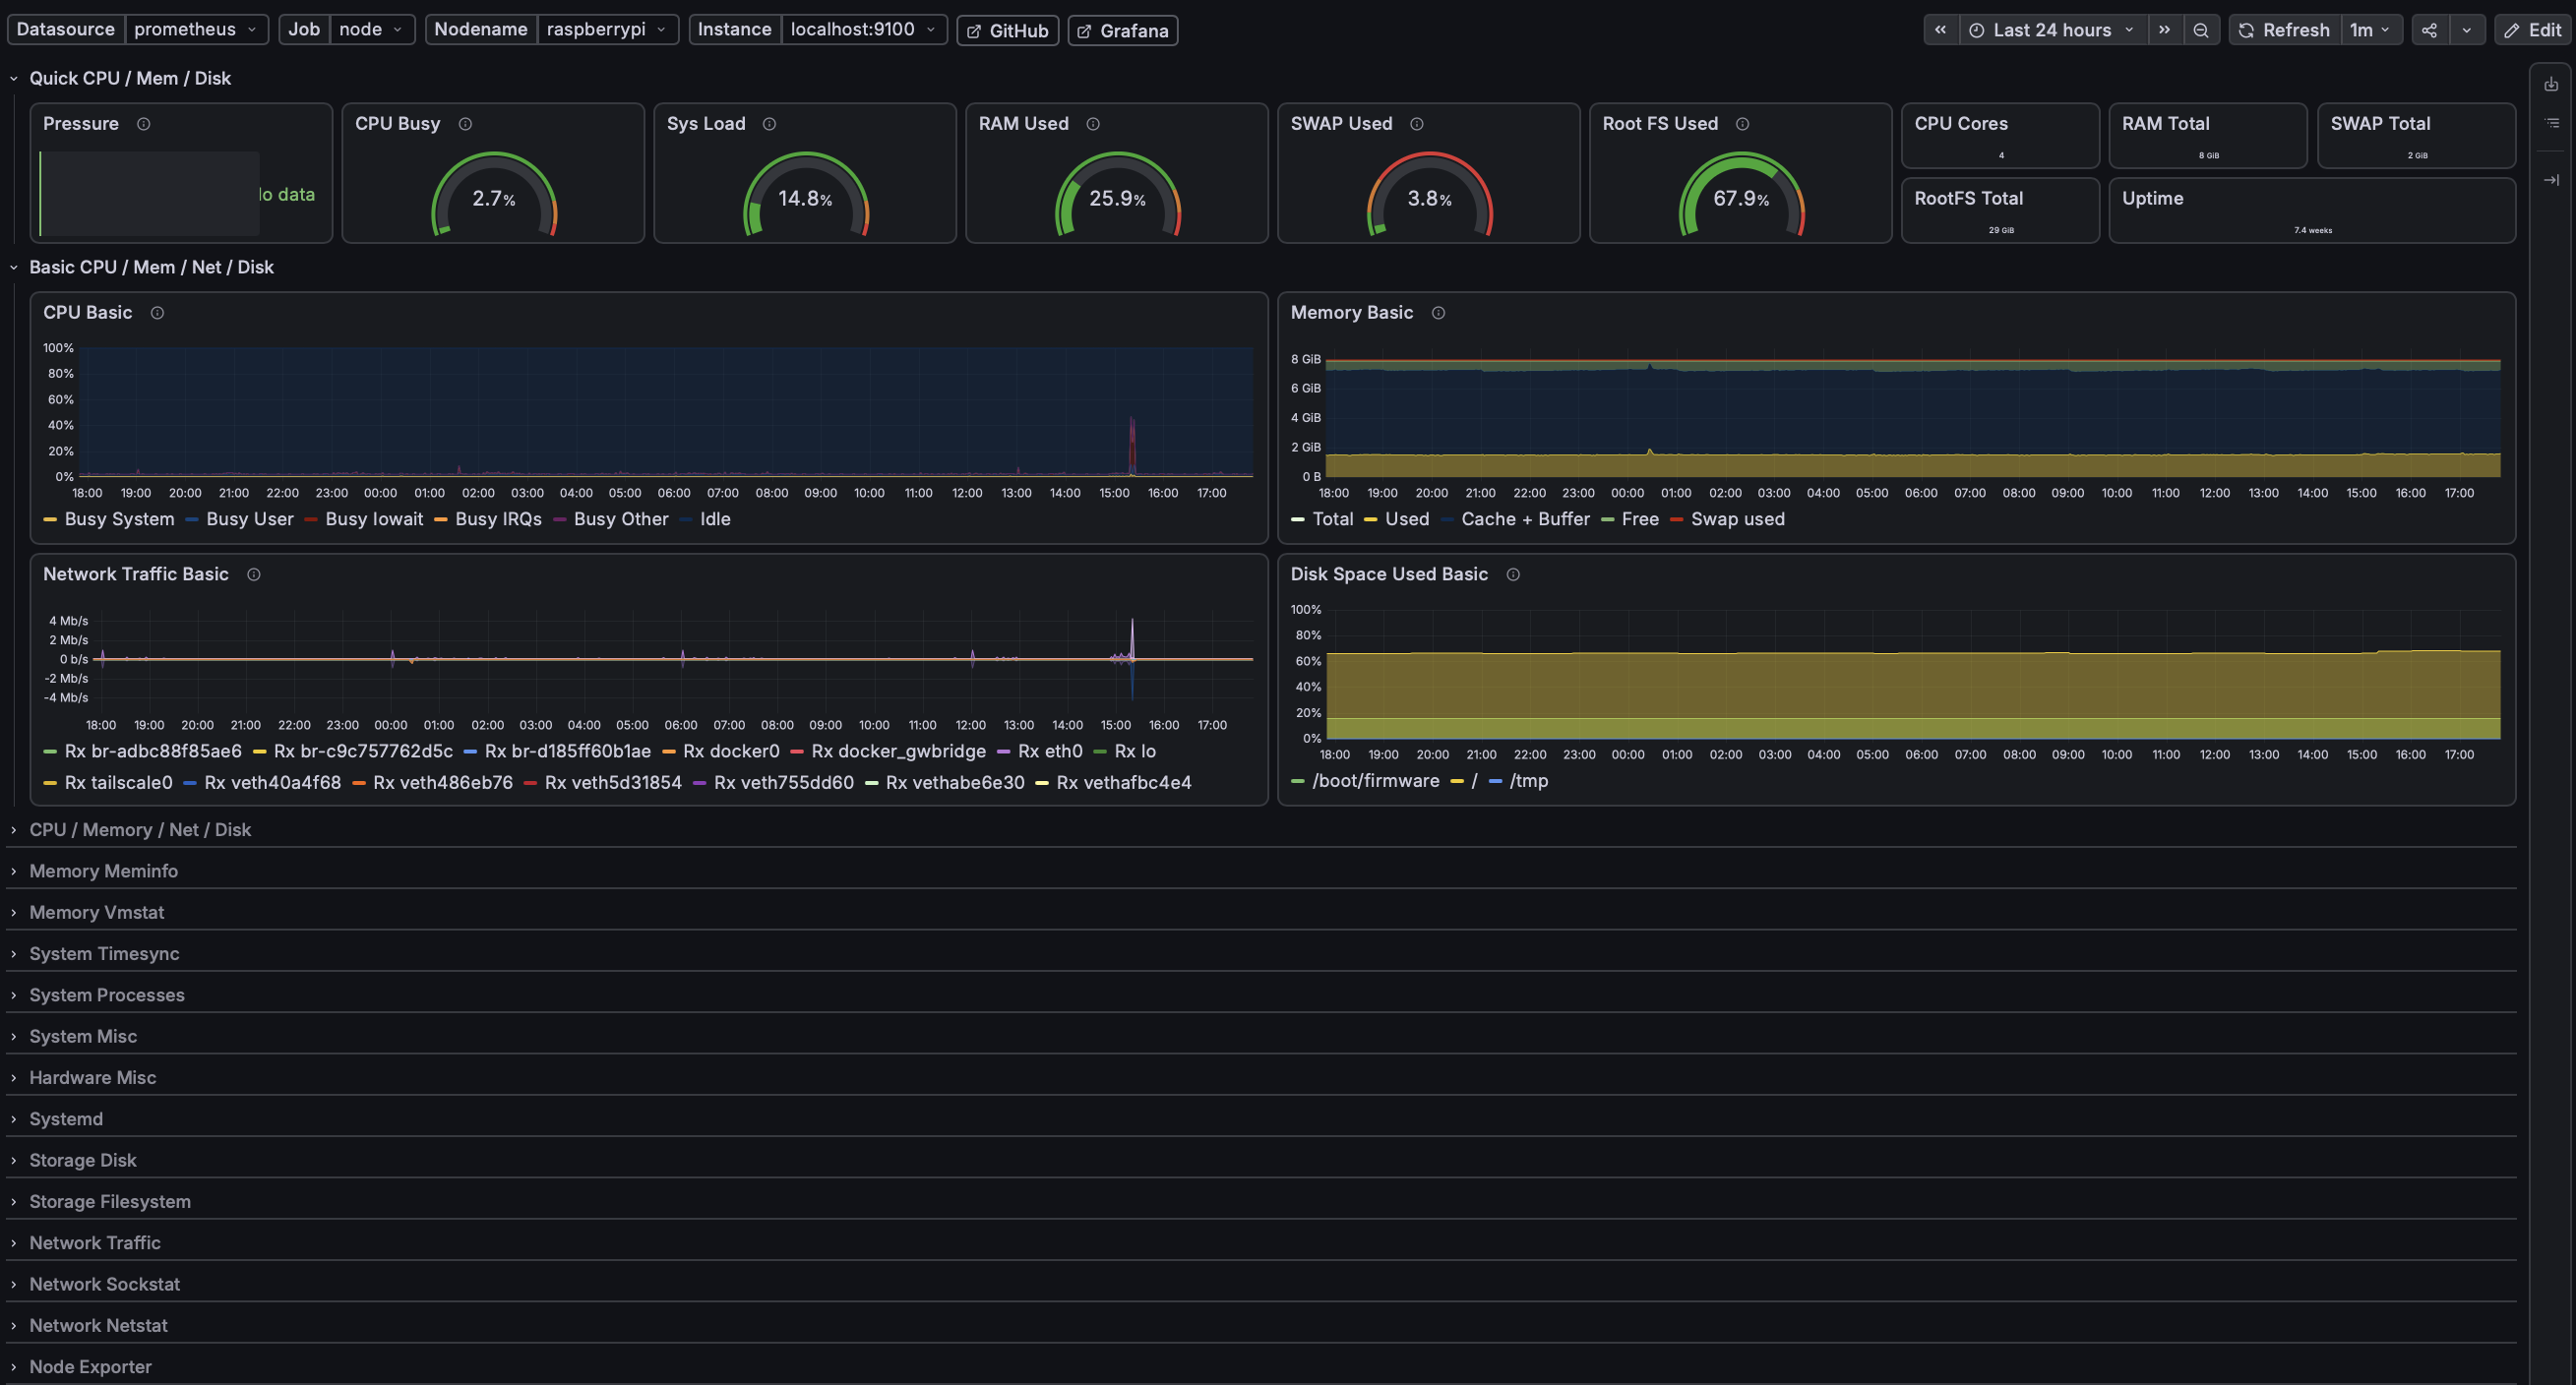
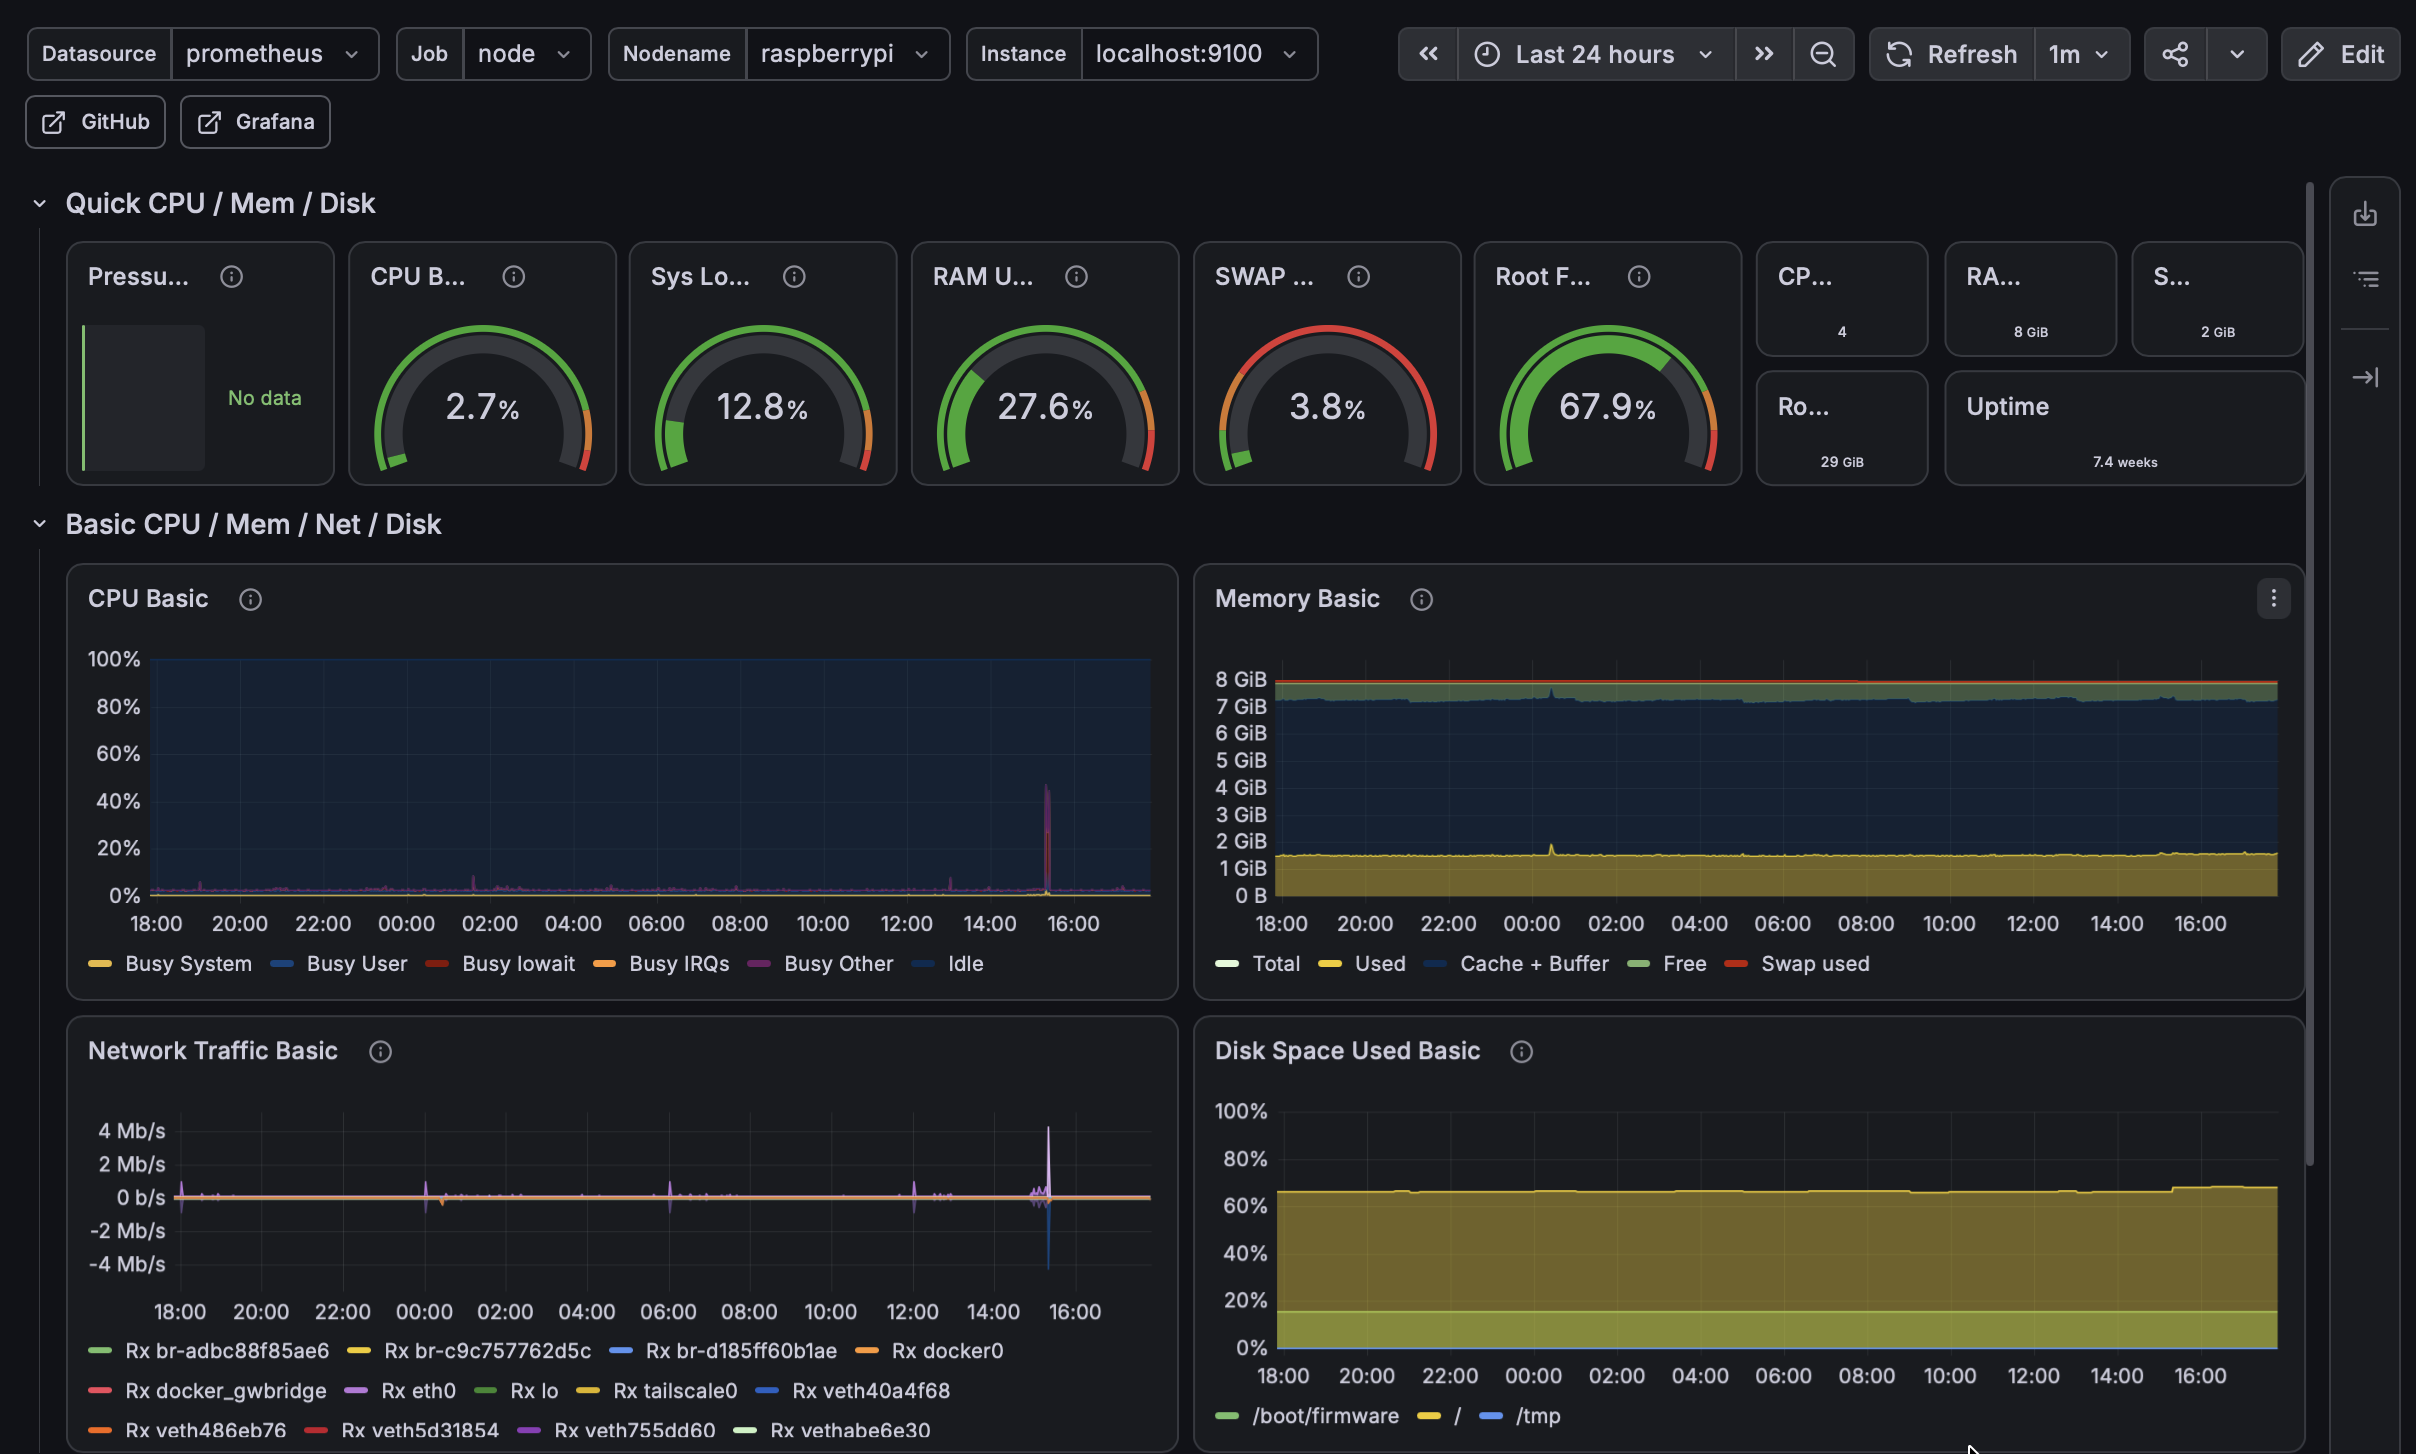
The Grafana dashboard can be filtered by job and instance.
Use the job selector to choose the Master Node (node) or one of the Worker Nodes (pi-1 through pi-8).
For the container metrics collected by cAdvisor, use the following Dashboard:
19792
Verification
After all the steps have been carried out, the verification step needs to be performed to ensure that everything is working properly. Therefore, open the following link:
http://master-ip:9090/classic/targets
If everything is working properly, the nodes should appear in the list and the status should be:
UP
References
- Prometheus Documentation: https://prometheus.io
- Grafana Documentation: https://grafana.com
- Prometheus Node Exporter Documentation: https://prometheus.io/docs/guides/node-exporter/
- cAdvisor Documentation: https://github.com/google/cadvisor
- Blackbox Exporter Documentation: https://github.com/prometheus/blackbox_exporter