Cloud Computing Projekt
Raspberry Pi Cluster mit KI-basierter Objekterkennung, MPI und Monitoring
Frontend Dashboard – Setup Guide
This manual explains how to set up, run, and deploy the React frontend for the edge computing monitoring system. The dashboard displays threat events, camera/node status, and connects to the backend API.
Table of Contents
- What the Frontend Does
- Requirements
- Local Setup (Development)
- Connecting to the Backend
- Docker Deployment
- Kubernetes (k3s) Deployment
- Project Files Overview
- Troubleshooting
- Verification
- References
What the Frontend Does
The dashboard shows everything happening in the edge monitoring system:
| Feature | What It Shows |
|---|---|
| Dashboard | Event statistics, event log |
| Events page | Full list of all detected events with filters |
| Cameras page | Connected sensor nodes and their status |
| Settings | Backend URL, refresh rate, theme toggle |
| Notification bell | Last 5 events with new event badge |
Requirements
On your computer
- Node.js 18 or later
- npm (comes with Node.js)
For deployment
- Docker (for container testing)
- kubectl (for k3s deployment)
Note: The backend must already be running at http://<ip>:8000, since the dashboard retrieves all data from it.
The dashboard is supported on Google Chrome and Microsoft Edge (desktop).
Local Setup (Development)
1. Clone the repository
git clone https://github.com/MikeMorelle/MikeMorelle.github.io.git
cd MikeMorelle.github.io/code/frontend
2. Install dependencies
npm install
3. Start the development server
PORT=3001 npm start
Why port 3001? Grafana already uses port 3000 on the Raspberry Pi.
4. Open the dashboard
Open your browser and go to:
http://localhost:3001
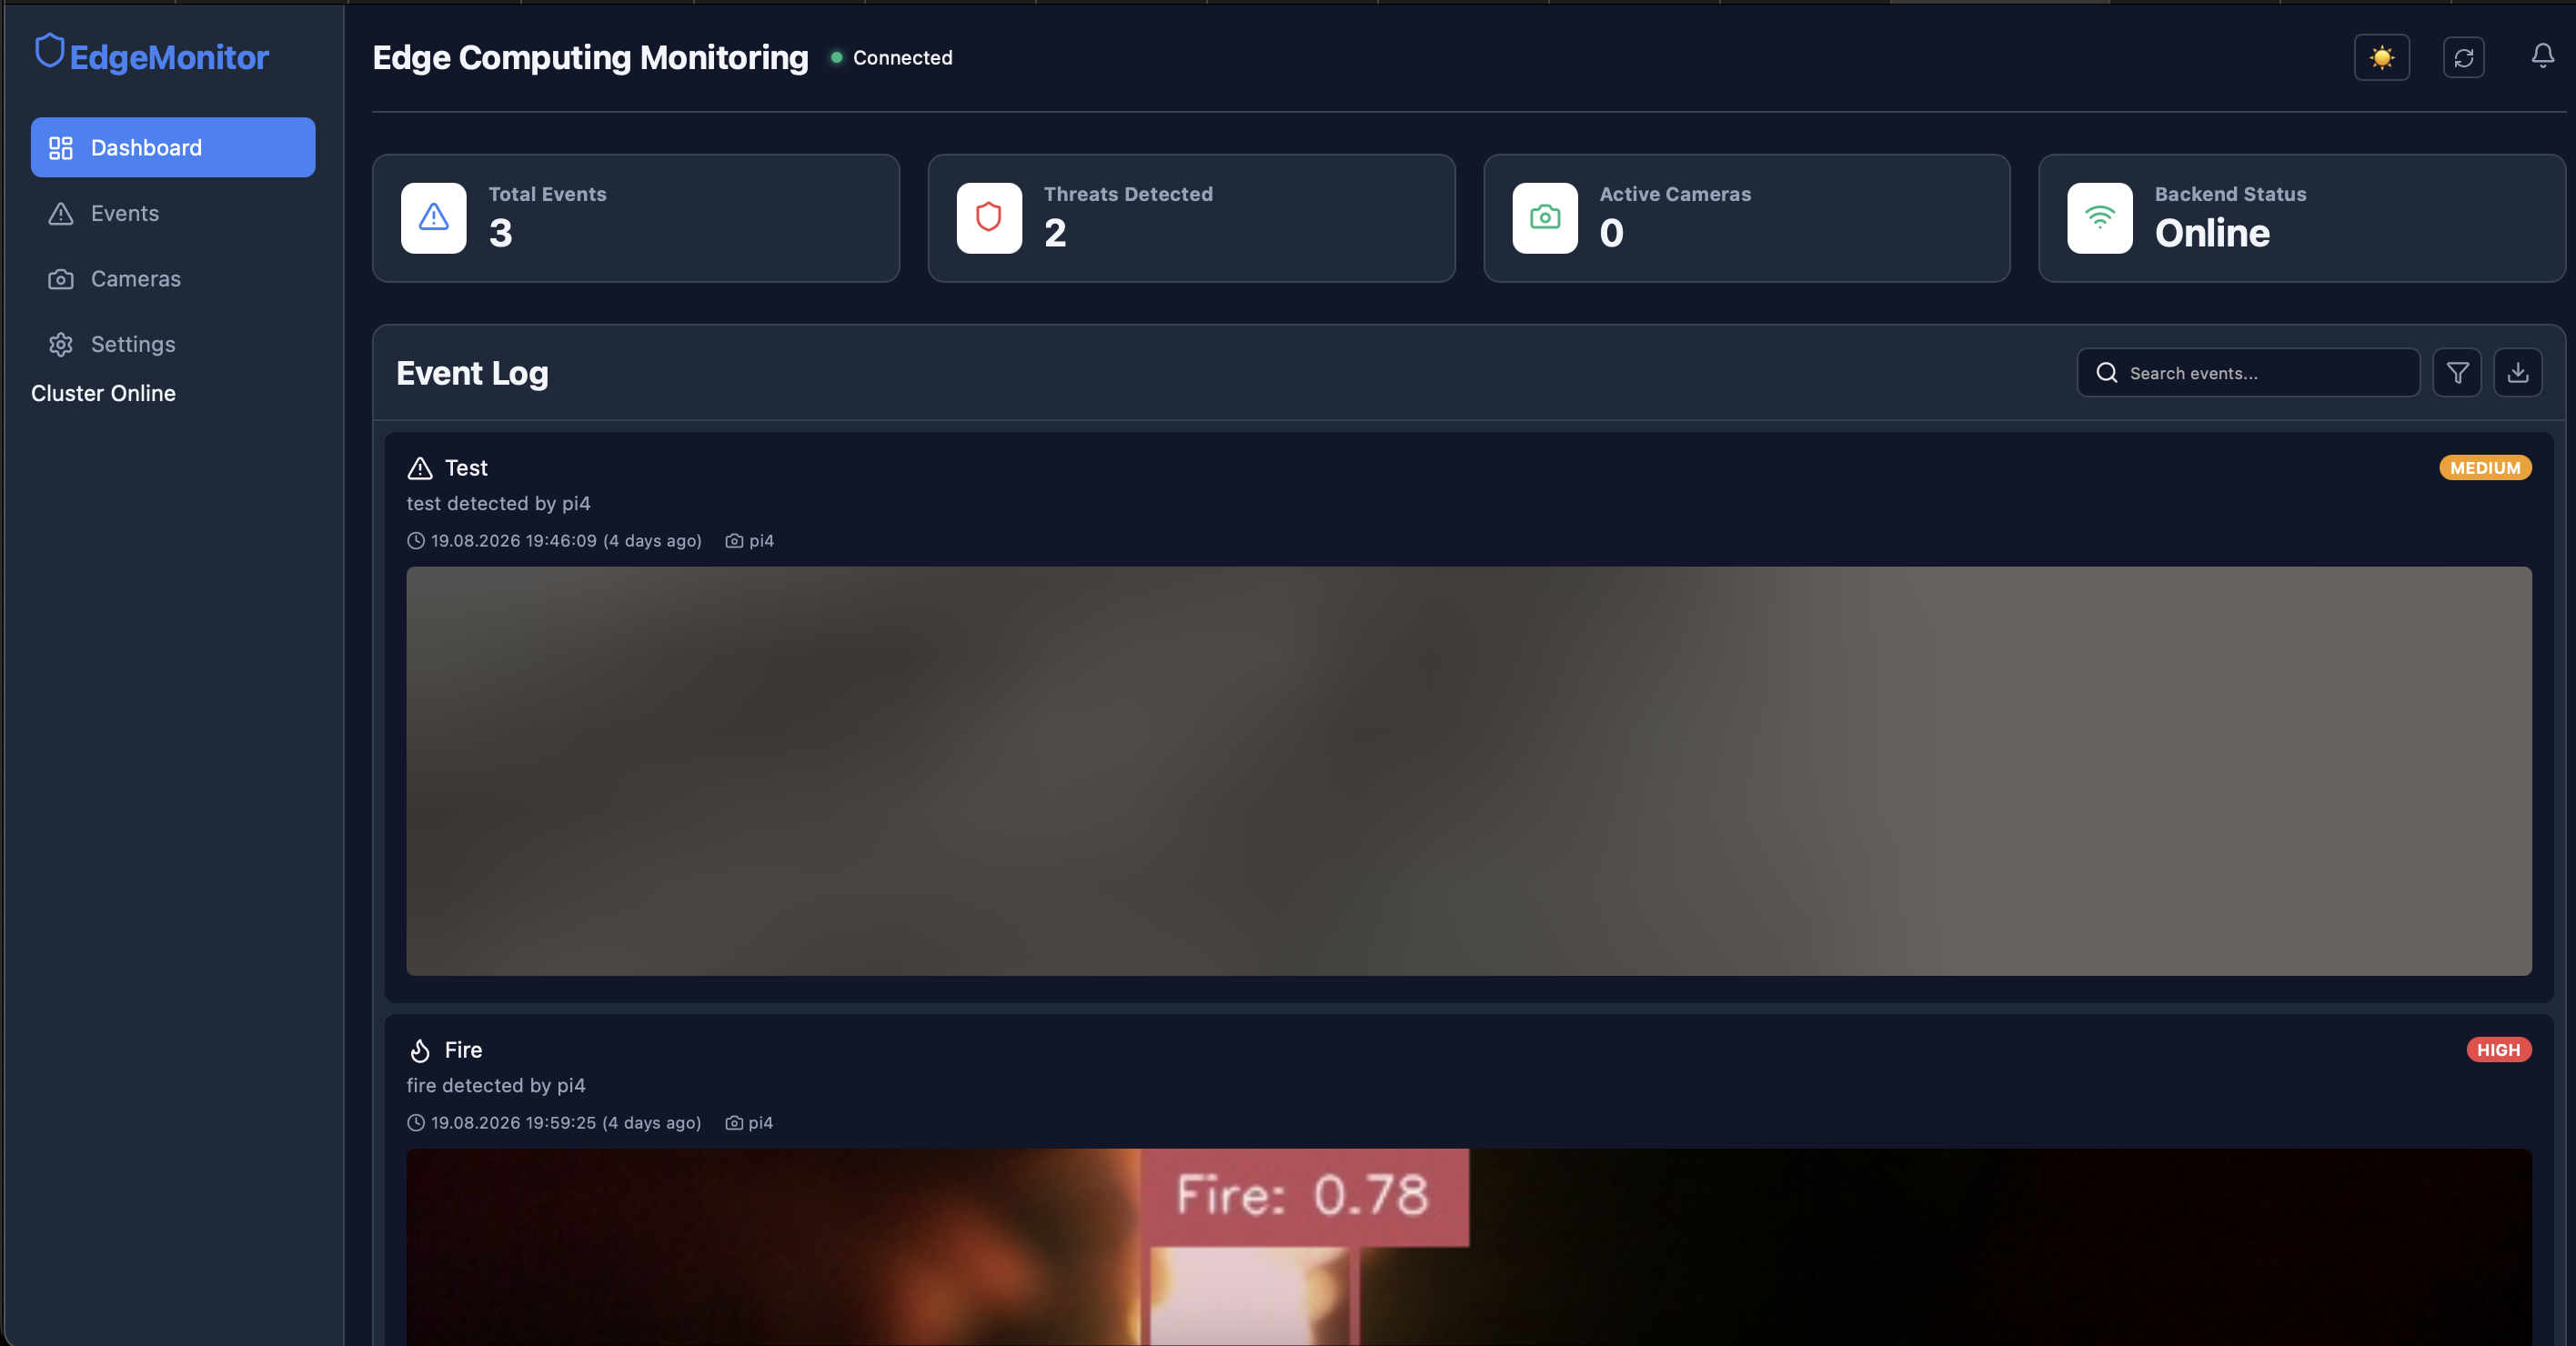
Screenshot: Dashboard main page with stats, event log
Connecting to the Backend
- Open Settings from the sidebar.
- Enter the backend URL.
Examples
- Local development:
http://localhost:8000 - Raspberry Pi (live system):
http://100.95.198.3:8000
- Click Test Connection.
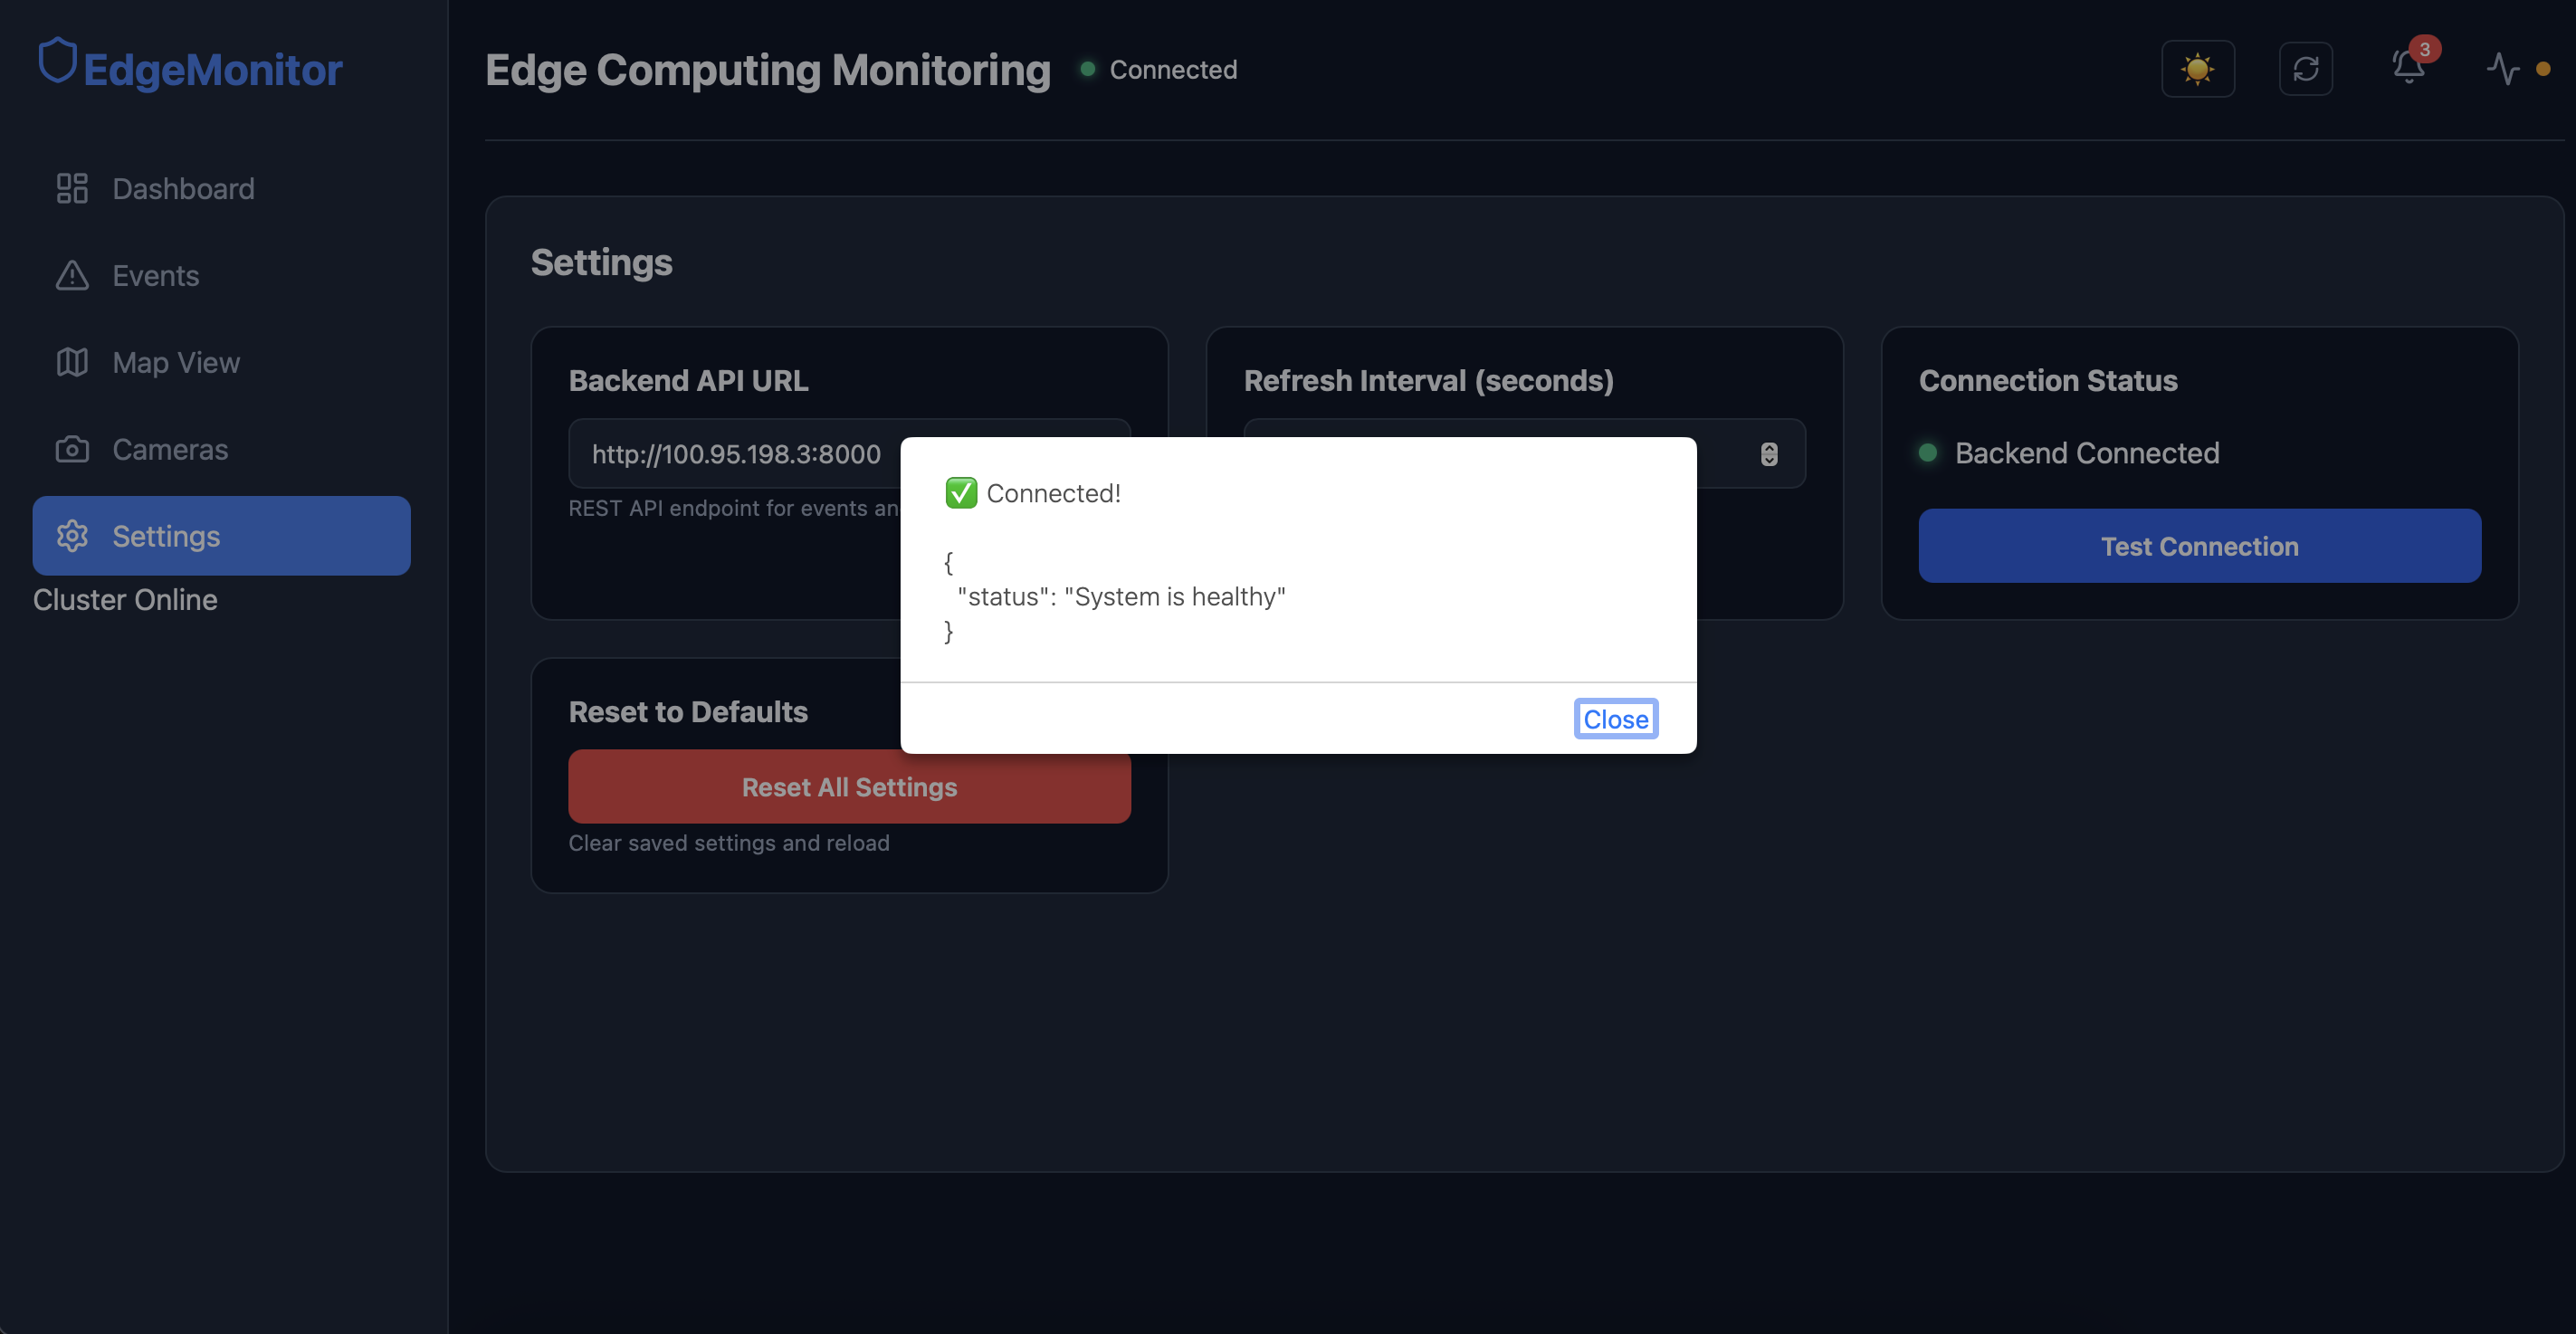
If successful, the dashboard displays:
✅ Backend connected!
The frontend checks the backend every 30 seconds by default. This interval can be changed in Settings.
Screenshot: Settings page with Test Connection success
Example API requests
curl http://100.95.198.3:8000/health
curl http://100.95.198.3:8000/events/
Docker Deployment
1. Build and start
docker compose up -d --build
The dashboard becomes available at:
http://100.95.198.3:3001
ℹ️ Local testing
By default, the container connects to the live backend (http://100.95.198.3:8000). If you want to test locally with a backend running on your own machine, use:
API_URL=http://localhost:8000 docker compose up -d --build
2. Stop the containers
docker compose down
What Docker does
- Builds the React application into static files.
- Uses Nginx to serve the files.
- Maps port 3001 on the host to port 80 inside the container.
- Injects the backend URL at build time via a build argument (see
docker-compose.yml).
nginx.conf
server {
    listen 80;
    root /usr/share/nginx/html;
    index index.html;

    location / {
        try_files $uri $uri/ /index.html;
    }
}
Screenshot: Docker Desktop showing
docker psoutput on the master node

Kubernetes (k3s) Deployment
Current status (August 2026): The k3s cluster was not yet available on the master node, so the manifests below have been prepared and tested locally with Rancher Desktop. When the cluster is operational, the frontend can be deployed with the following steps.
The k8s-deployment.yaml file creates:
- A Deployment with 2 frontend replicas
- A Service exposed on NodePort 30081
- An Ingress for routing traffic
Port configuration
| Component | Port |
|---|---|
| Backend NodePort | 30080 |
| Frontend NodePort | 30081 |
| Backend inside cluster | http://backend:8000 |
1. Deploy
kubectl apply -f k8s-deployment.yaml
Screenshot: Terminal output showing the deployment and service creation (from Rancher Desktop test)
.png)
2. Verify the pods
kubectl get pods -l app=frontend
Screenshot: Expected output
kubectl get podsshowing 2 frontend pods with status ofRunning(from Rancher Desktop test)
.png)
3. Access the dashboard
http://<node-ip>:30081
Screenshot: Browser window showing the dashboard loaded on
localhost:30081(from Rancher Desktop test)
.png)
Project Files Overview
Frontend/
├── src/
│   ├── components/
│   │   ├── Dashboard.jsx          # Main dashboard
│   │   ├── Sidebar.jsx            # Navigation
│   │   ├── EventLog.jsx           # Event list
│   │   ├── EventCard.jsx          # Individual event
│   │   ├── StatsCards.jsx         # Statistics
│   │   └── NotificationBell.jsx   # Recent events
│   ├── services/
│   │   └── api.js                 # Backend API
│   ├── styles/
│   │   └── dashboard.css          # Styling
│   ├── App.js
│   └── index.js
├── Dockerfile
├── docker-compose.yml
├── nginx.conf
├── k8s-deployment.yaml
└── package.json
Troubleshooting
| Problem | Cause | Fix |
|---|---|---|
| Frontend shows blank page on first load | Old localStorage value overrides the backend URL | Open an incognito window or clear browser storage for the dashboard URL. |
| Port 3000 already in use | Grafana uses port 3000 | The frontend uses port 3001 for development and Docker, avoiding the conflict. |
| Backend connection fails | Wrong URL or backend not reachable | Check the backend IP and port, and ensure it is running. Use Settings → Test Connection. |
Verification
- Start the backend on
localhost:8000(or confirm it is running on the master node at100.95.198.3:8000). - Start the frontend (dev or Docker) and open the appropriate URL.
- Open Settings → Test Connection.
You should see:
✅ Backend connected!
- Create a test event:
curl -X POST http://100.95.198.3:8000/events/ \
  -F "event_type=intrusion" \
  -F "node_id=cam-1" \
  -F "file=@/tmp/test-image.png"
- Refresh the dashboard – the event should appear within 30 seconds.
- Open the Cameras page to verify node registration.
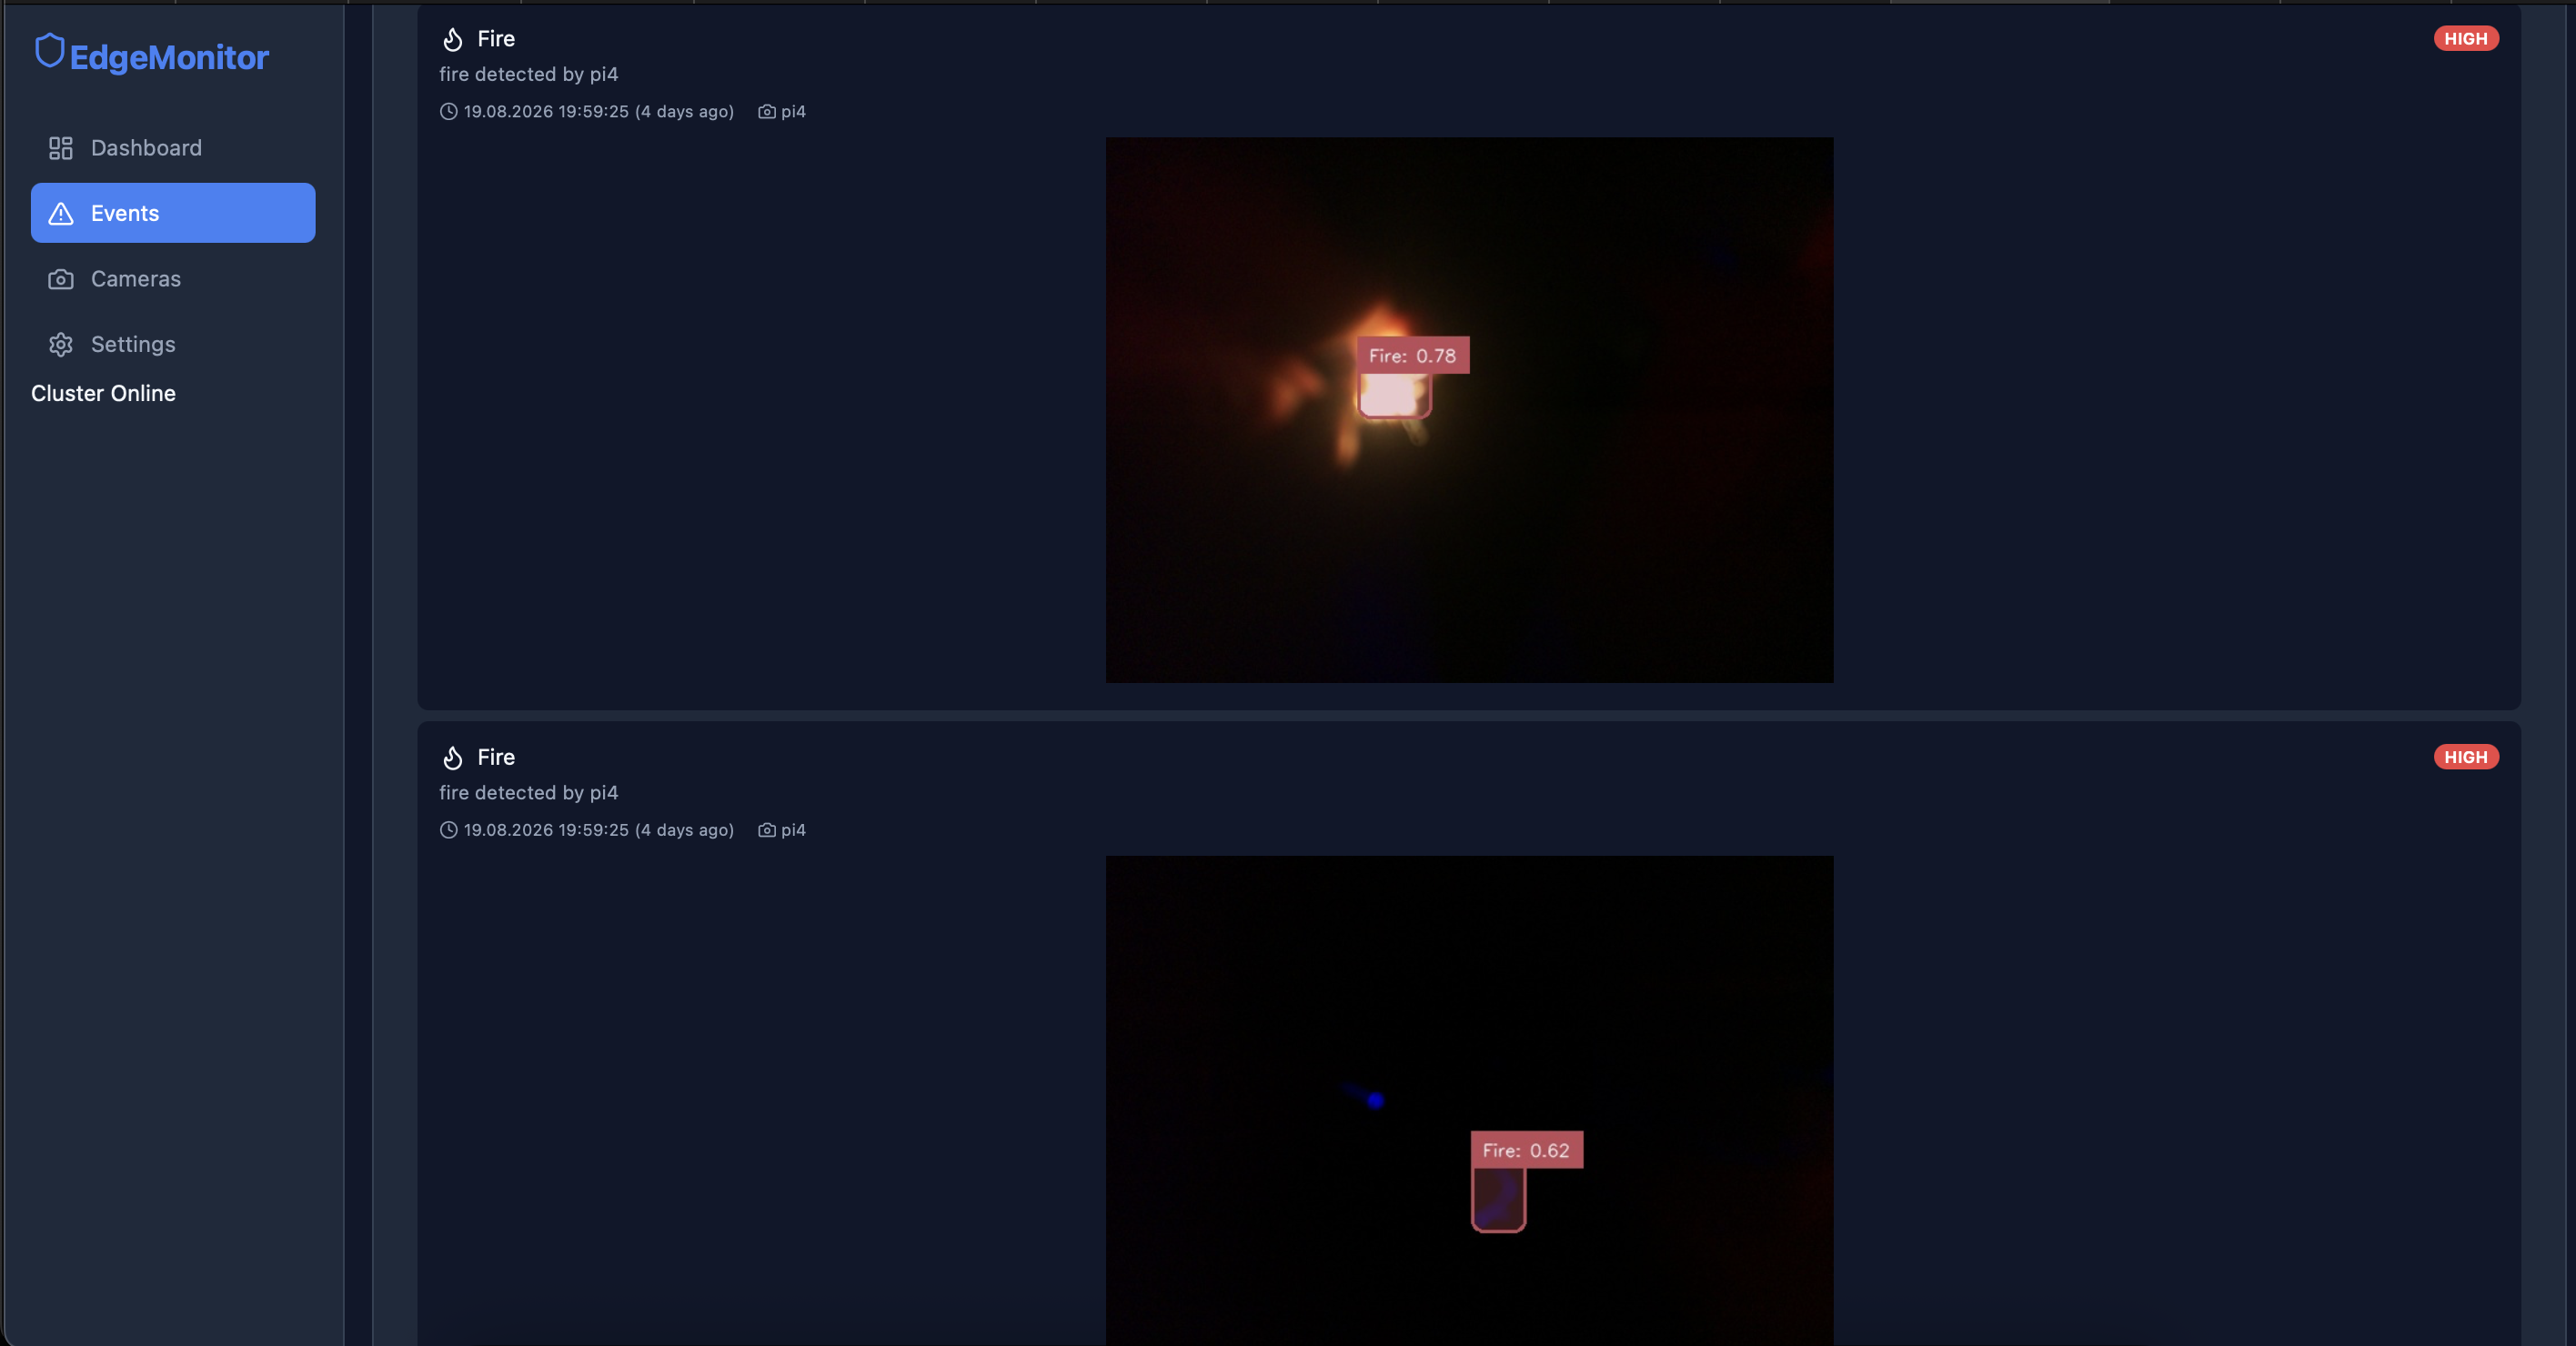
Screenshot: Dashboard showing a real event